DATA LITERACY SERIES (Text in Spanish / English)

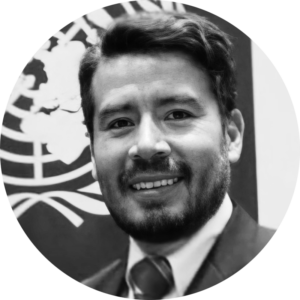
Entrevistado: Edgar Pacheco
Manager de Networking y Recaudación de Fondos
Sustainable Development Solutions Network (SDSN Bolivia)
En esta nueva “Serie de Alfabetismo de Datos” entrevistamos a participantes que han tomado nuestros cursos en línea. La serie continuara con la entrevista al participante del taller 2 Big Data y análisis de pobreza para el desarrollo sostenible: Edgar Pacheco. Este taller fue un trabajo conjunto entre AECID -a través de su Centro de Formación de la Cooperación Española en Santa Cruz de la Sierra, Bolivia- y Data-Pop Alliance. Lee sobre la experiencia de Edgar en este taller, cómo le pareció asistir a un taller virtual, y cómo planea aplicar lo aprendido en su area de trabajo en SDSN Bolivia. Al final de la transcripción podrás igualmente encontrar el video de la entrevista (nos disculpamos por los inconvenientes de sonido presentes en el video).
Mario Cajiao: Muchas gracias por aceptar la invitación a esta entrevista. Quisiera comenzar preguntando ¿cuál es tu nombre? Qué nos cuentes un poco de tu formación y el tipo de trabajo que realizas.
Edgar Pacheco: Soy Edgar Pacheco, soy de La Paz. Estoy trabajando SDSN Bolivia, que es la red de soluciones para el desarrollo sostenible. Es un trabajo multitasking, somos pocas personas, apenas cinco. La organización se creó en el 2018. Aporto con mi experiencia en el manejo de información y en el ámbito de los objetivos de desarrollo sostenible. Tengo cinco publicaciones de los Objetivos de Desarrollo Sostenible, muchas con información local. Las publicaciones se han constituido en los primeros VLR (Voluntary Local Reports) de La Paz, y han sido presentadas a nivel internacional. Y ahora en el SDSN estamos trabajando en el Atlas Municipal de los ODS Bolivia 2020. Tenemos por primera vez una gran cantidad de información. Estamos hablando de 339 municipios, y cada uno tiene aproximadamente 66 indicadores para la medición de los ODS. Entonces eso implica manejar información de distinta índole, desde pobreza hasta ratios en relación a desnutrición, la obesidad de niños, temas de tuberculosis y demás temas en relación con la salud. Después temas como: cobertura de agua, necesidades básicas satisfechas, necesidades básicas insatisfechas, medición multidimensional de la pobreza y varios otros ámbitos que se están estudiando en los ODS.
MC: Con relación al taller que acabas de terminar, ¿cómo te enteraste de este taller? ¿Qué te motivó a aplicar a la beca?
EP: Me llegó una invitación de Data Pop Alliance para presentarme a la convocatoria de la beca para el taller Big Data y Análisis de Pobreza. Bueno, no sé si era de Data Pop Alliance o era de la iniciativa del taller, supongo, porque estoy inscrito y soy seguidor en LinkedIn. Y también pienso, que fue gracias a las reuniones con AECID Bolivia que me contactaron. Es un correo misterioso la verdad. Pero lo interesante es que ya venía buscando intensamente cursos sobre Big Data. En mi anterior trabajo, con el Municipio de La Paz, postulé a un premio de manejo de Big Data ya que teníamos información administrativa y llegaba a raudales a mi oficina porque yo era director de investigación e información municipal. Toda esa información necesitaba ser procesada y analizada, y fue la fuente de más de 25 publicaciones sobre datos, ambientales, salud, turismo, educación, pobreza, deportes, estudios técnicos de empleabilidad, etcétera. Pero la verdad, es que en ese curso que tomé poco nos acercamos a Big Data. Teníamos la información, pero no los servidores. Y creo que íbamos en camino a conformar “algo” como Big Data. Pero en realidad la infraestructura de software y hardware es lo que nos faltó.
MC: ¿Te pareció útil este taller de Big Data y análisis de pobreza para el desarrollo sostenible?
EP: Por primera vez veo algo tan también estructurado, con buenas definiciones y con científicos de datos. La verdad es que nunca había tenido ésta experiencia. Siempre estaba en mi imaginario y la verdad estaba comenzando con tutoriales de Python, pero me di me surgieron preguntas de cómo es su aplicabilidad, de cómo se están organizando y qué beneficios se pueden obtener a través del manejo de Big Data. Ver la dinámica del metadato, su conformación, su georeferencia y el manejo de imágenes satelitales, despertaron mucho en mi un verdadero y pude darme cuenta de la utilidad que tienen. Veo un horizonte increíble para el manejo de Big Data. En el caso del uso de fuentes tradicionales de datos, como las encuestas, estas cuestan mucho dinero. Es ahí donde pienso que las fuentes de recursos (datos) no tradicionales, de información estadística no tradicional, sea la solución para América Latina.
"La teoría es importante, pero el hit del asunto está en saber aplicar esa teoría. Y eso es un todo un reto, pero no lo veo imposible. Creo que puede ser la solución a muchos problemas que tenemos en relación a las mediciones de información, la toma de decisiones y las políticas públicas basadas en evidencia."
Edgar Pacheco
MC: ¿Y qué fue específicamente lo que más te gustó del taller?
EP: Me encantó la forma en la que explicaron los algoritmos y las formas de cálculos. También cuando manejaron imágenes satelitales. El estudio de Ecuador me encantó y el estudio de Bogotá. El caso de Bogotá fue un caso para el cálculo de la pobreza basado en niños que iban a los colegios con información del Ministerio de Educación versus una instancia que trabaja en la OPI de Oxford. El conferencista articuló la información para tomar decisiones óptimas en relación a la colocación de bonos y/o apoyo a las unidades familiares que estaban al borde del de caer por debajo de la línea de pobreza. Después, la otra que me fascinó fue el ejemplo de Maldivas con los datos de telefónicos. Y el otro que me fascinó fue el de Lima Perú con datos de movilidad y fuente de recursos de Meta (Data for Good) y de Google Trends. De hecho Google Trends ya lo he empezado a usar.
MC: Entonces podemos decir que lo que más te gustó fueron los casos y las aplicaciones que se vieron.
EP: Sí. La teoría es importante, pero el hit del asunto está en saber aplicar esa teoría. Y eso es un todo un reto, pero no lo veo imposible. Creo que puede ser la solución a muchos problemas que tenemos en relación a las mediciones de información, la toma de decisiones y las políticas públicas basadas en evidencia.
MC: ¿Te gustó realizar el curso en modalidad virtual?
EP: bueno, no hay otra forma, de lo contrario serían talleres muy costosos. Nos tendríamos que mover a donde confirmen la sede, y no podrías tener tanta gente pensando en eso. La modalidad virtual ya ha tomado (hace 10 años) mucho desarrollo. Ya existen plataformas, pizarras electrónicas, hay diversas metodologías de enseñanza y de tener acceso al material. Igualmente es posible compartir bases de datos. A ver, no creo que sea la mejor forma, ya que somos más presenciales que virtuales, pero lastimosamente es la más eficiente. La virtualidad nos está dando los nuevos caminos y las soluciones efectivas que necesitamos.
MC: ¿Recomendarías este taller a otras personas?
EP: sí, la verdad creo que es muy útil para tomadores de decisión, administradores de datos, ingenieros, funcionarios públicos o incluso personas que pertenecen o otros sectores como a la banca privada financiera o alianzas público privadas. La verdad es que sí es muy útil, es un nuevo camino para para mejorar la toma de decisiones en muchos ámbitos, como por ejemplo, en los mercados financieros, para realizar un simple estudio de mercado de oferta y demanda, de la inserción de un producto o hasta para saber la vulnerabilidad del mercado laboral o la movilidad humana. Realmente puede ayudar a muchos sectores y en todos los niveles.
MC: ¡Muchas gracias Edgar!
Para ver el video de la entrevista haz click aquí:
English Version
In our new “SDG Data Lab” series, we interview different participants of our online courses or workshops. This edition is an interview with Workshop 2 Big Data and Poverty Analysis for Sustainable Development participant, Edgar Pacheco. Read about Edgar’s experience in this workshop, his opinion on taking an online workshop, and how he plans to implement what he learned in his work at SDSN Bolivia.”
Mario Cajiao: Thank you for accepting the invitation to this interview. I would like to start by asking your name and also for you to tell us a little bit about your background and the type of work you do.
Edgar Pacheco: My name is Edgar Pacheco; I am from La Paz. I am working for SDSN Bolivia, which is a network of solutions for sustainable development. It is a multitasking job, we are few people, just five. The organization was created in 2018. I contribute with my experience in information management related to the Sustainable Development Goals (SDGs). I have five Sustainable Development Goals publications, many with local information. The publications have become the first VLRs (Voluntary Local Reports) of La Paz and have been presented internationally. Currently at SDSN we are working on the Municipal Atlas of the SDGs Bolivia 2020. For the first time, we have a large amount of information. We are talking about 339 municipalities, and each has approximately 66 indicators for measuring the SDGs. So that means handling different types of information, from poverty measures to ratios in relation to malnutrition, child obesity, tuberculosis and other health-related issues. Then issues such as: water coverage, met basic needs, unmet basic needs, multidimensional poverty measurement and several other areas that are being studied in the SDGs.
MC: Regarding the workshop you just finished, how did you find out about this workshop? What motivated you to apply for the scholarship?
EP: I got an invitation from Data Pop Alliance to apply for the scholarship call for the Big Data and Poverty Analytics workshop. Well, I don’t know if it was from Data Pop Alliance or if it was from the workshop initiative, I guess, because I am registered and I am a follower on LinkedIn. And I also think it was thanks to the meetings with AECID Bolivia that they contacted me. It’s a mysterious email, really. But the interesting thing is that I had already been looking for courses on Big Data. In my previous job, with the Municipality of La Paz, I applied for a Big Data management award because we had administrative information, and it was pouring into my office because I was the Director of Research and Municipal Information. All that information needed to be processed and analyzed, and it was the source of more than 25 publications on data, environmental, health, tourism, education, poverty, sports, technical studies of employability, and so on. But the truth is that in that course I took, we didn’t get very close to Big Data. We had the information, but not the servers. I also think we were on our way to conform “something” like Big Data. But actually, the software and hardware infrastructure are what we lacked.
MC: Did you find this workshop on Big Data and poverty analysis for sustainable development useful?
EP: This workshop was the first time I saw something so well structured, with good definitions and data scientists. The truth is that I had never had this experience. It was always in my imagination and the truth is that I was starting with Python tutorials, but I started to wonder about its applicability, how it is being organized and what benefits can be obtained through the management of Big Data. Seeing the dynamics of metadata, its conformation, its georeference and the management of satellite images, taught me so much about the usefulness they have. I see incredible applicability for Big Data management. In the case of using traditional data sources, such as surveys, they cost a lot of money. That is where I think that non-traditional sources (data), non-traditional statistical information, is the solution for Latin America.
"The theory is important, but the best part is knowing how to apply that theory. And that is quite a challenge, but I don't think it's impossible. I think it can be the solution to many problems we have in relation to information measurements, decision making and evidence-based public policies."
Edgar Pacheco
MC: What specifically did you like most about the workshop?
EP: I loved the way they explained the algorithms and calculations and how they handled satellite images. I loved the Ecuador study and the Bogotá study. The Bogotá case was a case for calculating poverty based on children going to school, using information from the Ministry of Education versus an instance working in the Oxford IPO. The speaker articulated the information to make optimal decisions regarding the placement of vouchers and/or support to households that were on the verge of falling below the poverty line.
Additionally, I was fascinated by the Maldives example with telephone data. I was also very intrigued by the Lima, Peru example of using mobility data and sourcing from Meta (Data for Good) and Google Trends. In fact, I have already started using Google Trends.
MC: So, we can say that what you most enjoyed the cases and the applications that were shown?
EP: Yes, the theory is important, but the best part is knowing how to apply that theory. That is also quite a challenge, but I don’t see it as impossible. I think it can be the solution to many problems we have in relation to information measurements, decision making and evidence-based public policies.
MC: Did you enjoy taking the course virtually?
EP: Well, there is no other way, otherwise they would be very expensive workshops. We would have to move to where they could find a venue, and you could not have so many people thinking about that. The virtual modality has already undergone (over the last 10 years) a lot of development. There are already platforms, electronic whiteboards, there are different teaching methodologies and access to the material. It is also possible to share databases. I don’t think it is the best way, since we are more face-to-face than virtual, but unfortunately it is the most efficient. Virtuality is giving us the new ways and the effective solutions we need.
MC: Would you recommend this workshop to others?
EP: Yes, the truth is that I think it is very useful for decision makers, data managers, engineers, public officials or even people who belong to other sectors such as private financial banking or public-private partnerships. The truth is that it is very useful, it is a new way to improve decision making in many areas, for example, in financial markets, to carry out a simple market study of supply and demand, the insertion of a product or even to know the vulnerability of the labor market or human mobility. It can really help in many sectors and at all levels.
MC: Thank you very much Edgar!


![M002 - Feature Blog Post [WEB]](https://datapopalliance.org/wp-content/uploads/2025/10/M002-Feature-Blog-Post-WEB.png)