LINKS WE LIKE #21
With the upcoming presidential election in the U.S., media outlets such as ABC News and The Economist, and even scholars like Alan L. Abramowitz, have searched for creative and insightful ways to use big data and data analysis as a way of better understanding the electorate and forecasting the results. In particular, different organizations are seeking to leverage big data to predict electoral outcomes. Project Five Thirty Eight, for instance, is a series models aimed at forecasting the 2020 elections outcomes by analyzing polling, economic and demographic data.
Even though (big) data holds a huge potential in the electoral field, it also carries important risks. As the 2016 U.S. election showed, using data to run campaigns can lead to further polarization by creating eco chambers where algorithms that reproduce and reinforce predetermined political views are used. According to experts such as Harvard Professor Cass Sunstein, and Eli Pariser, entrepreneur and author of The Filter Bubble: How the New Personalized Web Is Changing What We Read and How We Think, big data is being increasingly used to create a “bubble” where like-minded people exclusively receive similar information that consequently draws them to a more extreme stance. Pariser advocates for data models that are clearly communicated and used responsibility to avoid a complete fragmentation and polarization of society. Furthermore, as Colin Koopman, head of Philosophy & Director of New Media & Culture Certificate Program at the University of Oregon stated, “data will drive democracy” and it is all because “our society lacks an information ethics adequate to its deepening dependence on data”. We need to use data to broaden our understanding, but the question about how to regulate and reduce ethical challenges remains. The way in which we set out to do both tasks can and will determine if the utilization of data in the electoral process is beneficial or harmful.
In this week’s Links We Like we explore the intricacies of bringing data analytics into the electoral cycle:
By using polling, economic and demographic data, The Economist created a real time forecasting tool (updated daily). To do so, they generated different models that aim to measure the outcome of the general election in terms of electoral college and popular vote. They have also tailored a forecast model for each state that shows how other states might move in response to each state’s numbers.
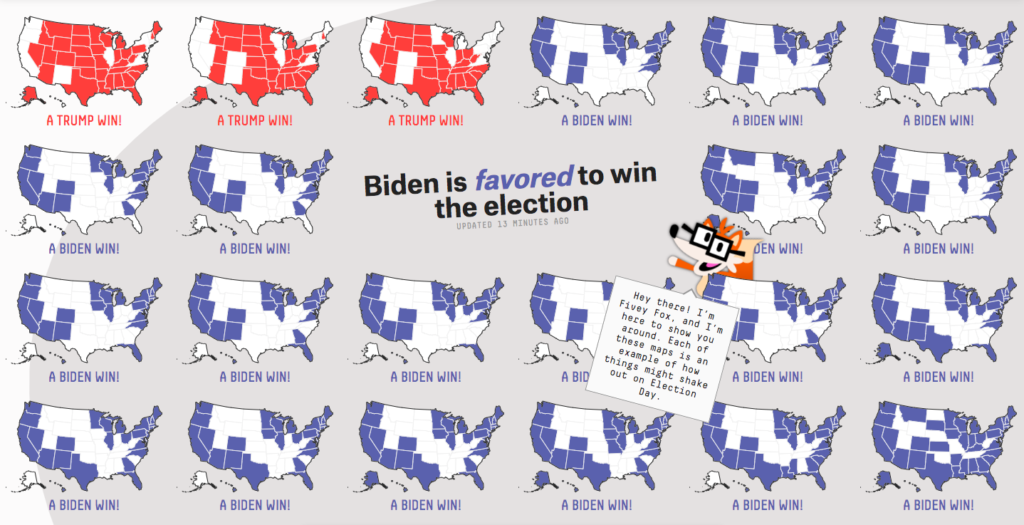
Project Five Thirty Eight launched a forecast platform in which they simulated the 2020 presidential election 40,000 times based on current polls as well as economic and demographic data, in order to determine the chances each candidate has of winning. They further created a map that lays out the states that are most likely to vote for either candidate and the states that have a close call in the middle. This information is also available in a timeline, where the change over time in polls is recorded.
Ajit Singh from the Data Science Foundation says that data analytics has evolved to such measures that it is currently the “brain of every election since the Obama campaign”. He further asses that big data analytics is used in two main ways: forecasting electoral results and helping campaigns have better understanding of their voters, as well as adapt to their sentiments. However he warns of an important risk when forecasting results: any small miscalculation can completely alter the outcomes and influence voters willingness to actually vote.
Sean Illing interviews Yale political science Professor and author of Hacking the Electorate: How Campaigns Perceive Voters, Eitan Hersh to understand the way in which campaigns use data to mobilize voters. Hersh argues that “if you have enough data, you can predict how people will behave, how they will vote” and therefore you can have a better understanding of what your support base is. Yet, the risk lies in that candidates can also adjust their campaigns to vouch only for what their voters want, ending up excluding the rest of the population.
In an interview with Dianne Timblin of American Scientist, Jamie Bartlett explains how democracy and elections are turning into a data science, where voters are 1’s and 0’s that can be observed and targeted through algorithms that are then used to predict the person’s probability of leaning one way or the other in an election. In this way, the campaign seeks to fully understand each individual and give him or her a specific propaganda message that is perfectly tailored to the person’s likes, needs, fears and preferences. In this sense, Barlett argues that big data is now used in campaigns to not only identify their strong support bases, but also the undecided voters who are then targeted with stronger and larger propaganda to turn their vote.
Has big data reduced the American electorate into 1 and 0, yes’s and no’s? According to Chuck Todd and Carrie Dan, this is the case. The researchers argue that it wasn’t data itself that broke the electoral system, but rather the misuse and manipulation of it that brought us to a “breaking point”. In their findings, big data has made campaign managers realize that winning the middle ground electorate may not be as important as previously thought, but rather attempt to guarantee their support base votes, and therefore creating a much more polarized electoral panorama.
Further Afield
Dive deeper into Big Data and Elections
Big Data, Elections and Democracy
- How democracy can survive Big Data
- Data-drive elections: implications and challenges for democratic societies
- How the Trump campaign used Big Data in practice
- How Possible Is It Now to Predict US Elections With Data Analysis
2020 Elections and Big Data
