
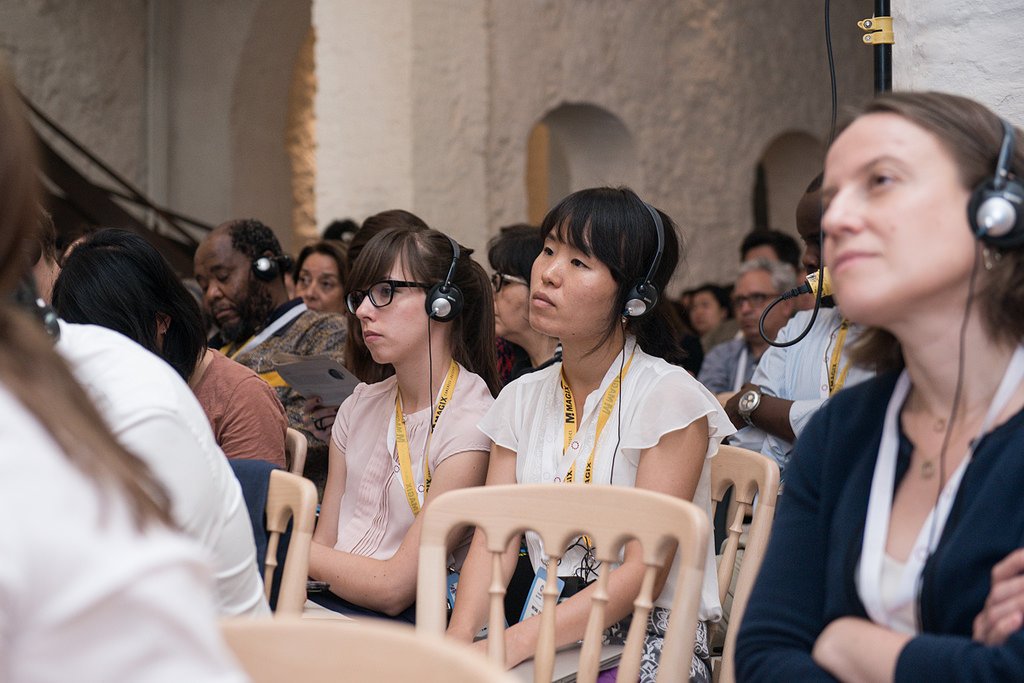
With over 400 registered participants, 3 days filled with events and presentations and countless stimulating conversations, the Cartagena Data Festival was an extraordinary experience and in our opinion, a great success. The festival was livestreamed for people following from home, and interacted with the Twitter community's questions and comments. Simultaneous translation was available for non-English speaking attendees.

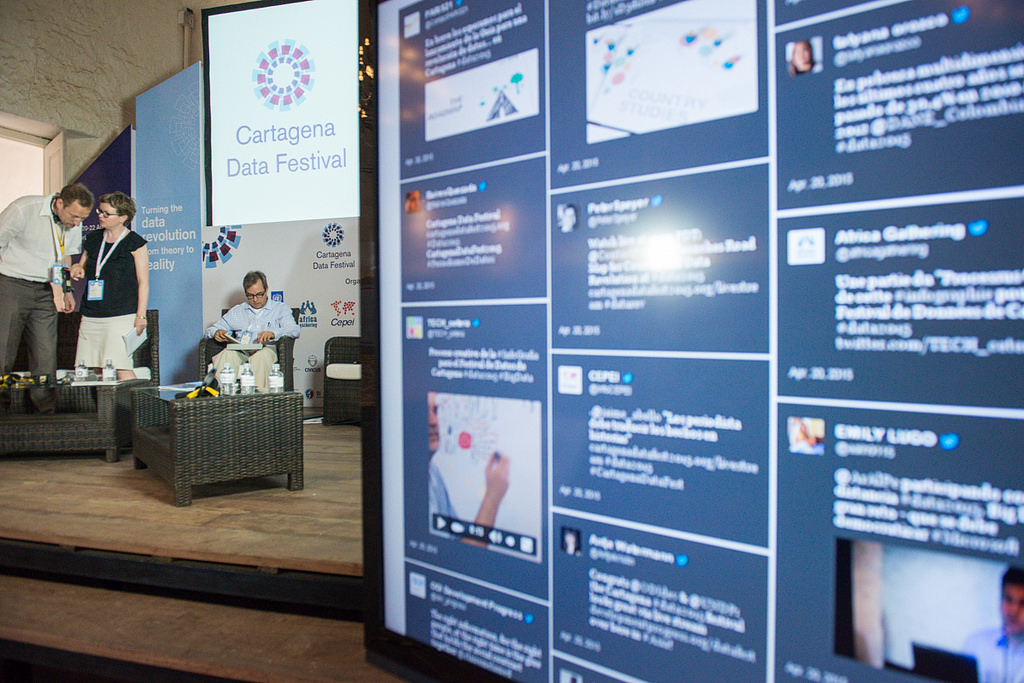
Questions were taken from a social media feed during plenary sessions

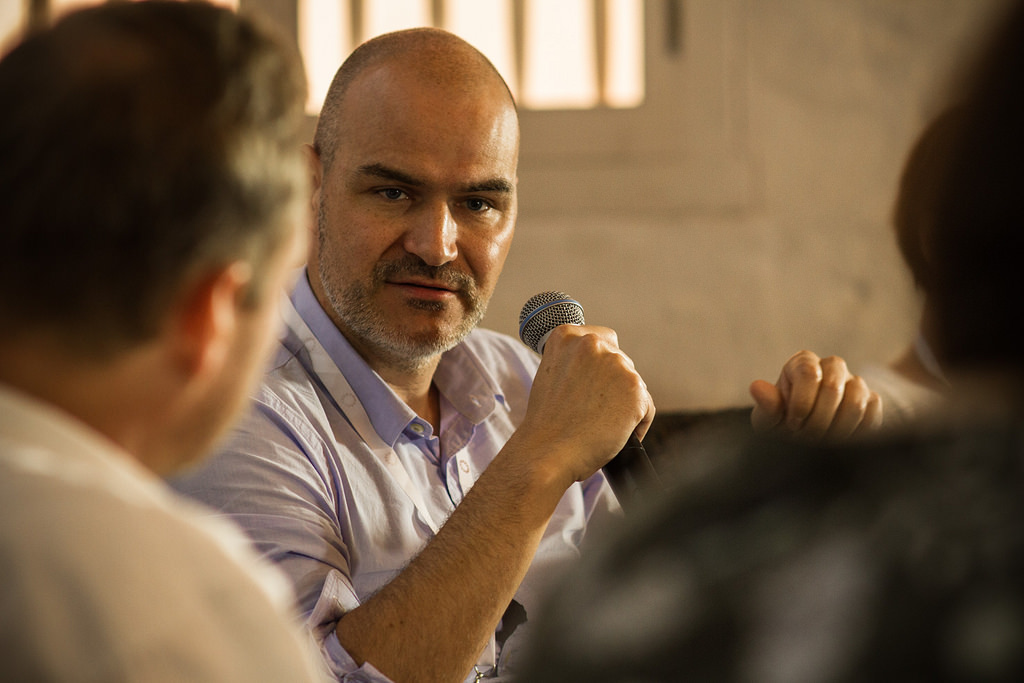

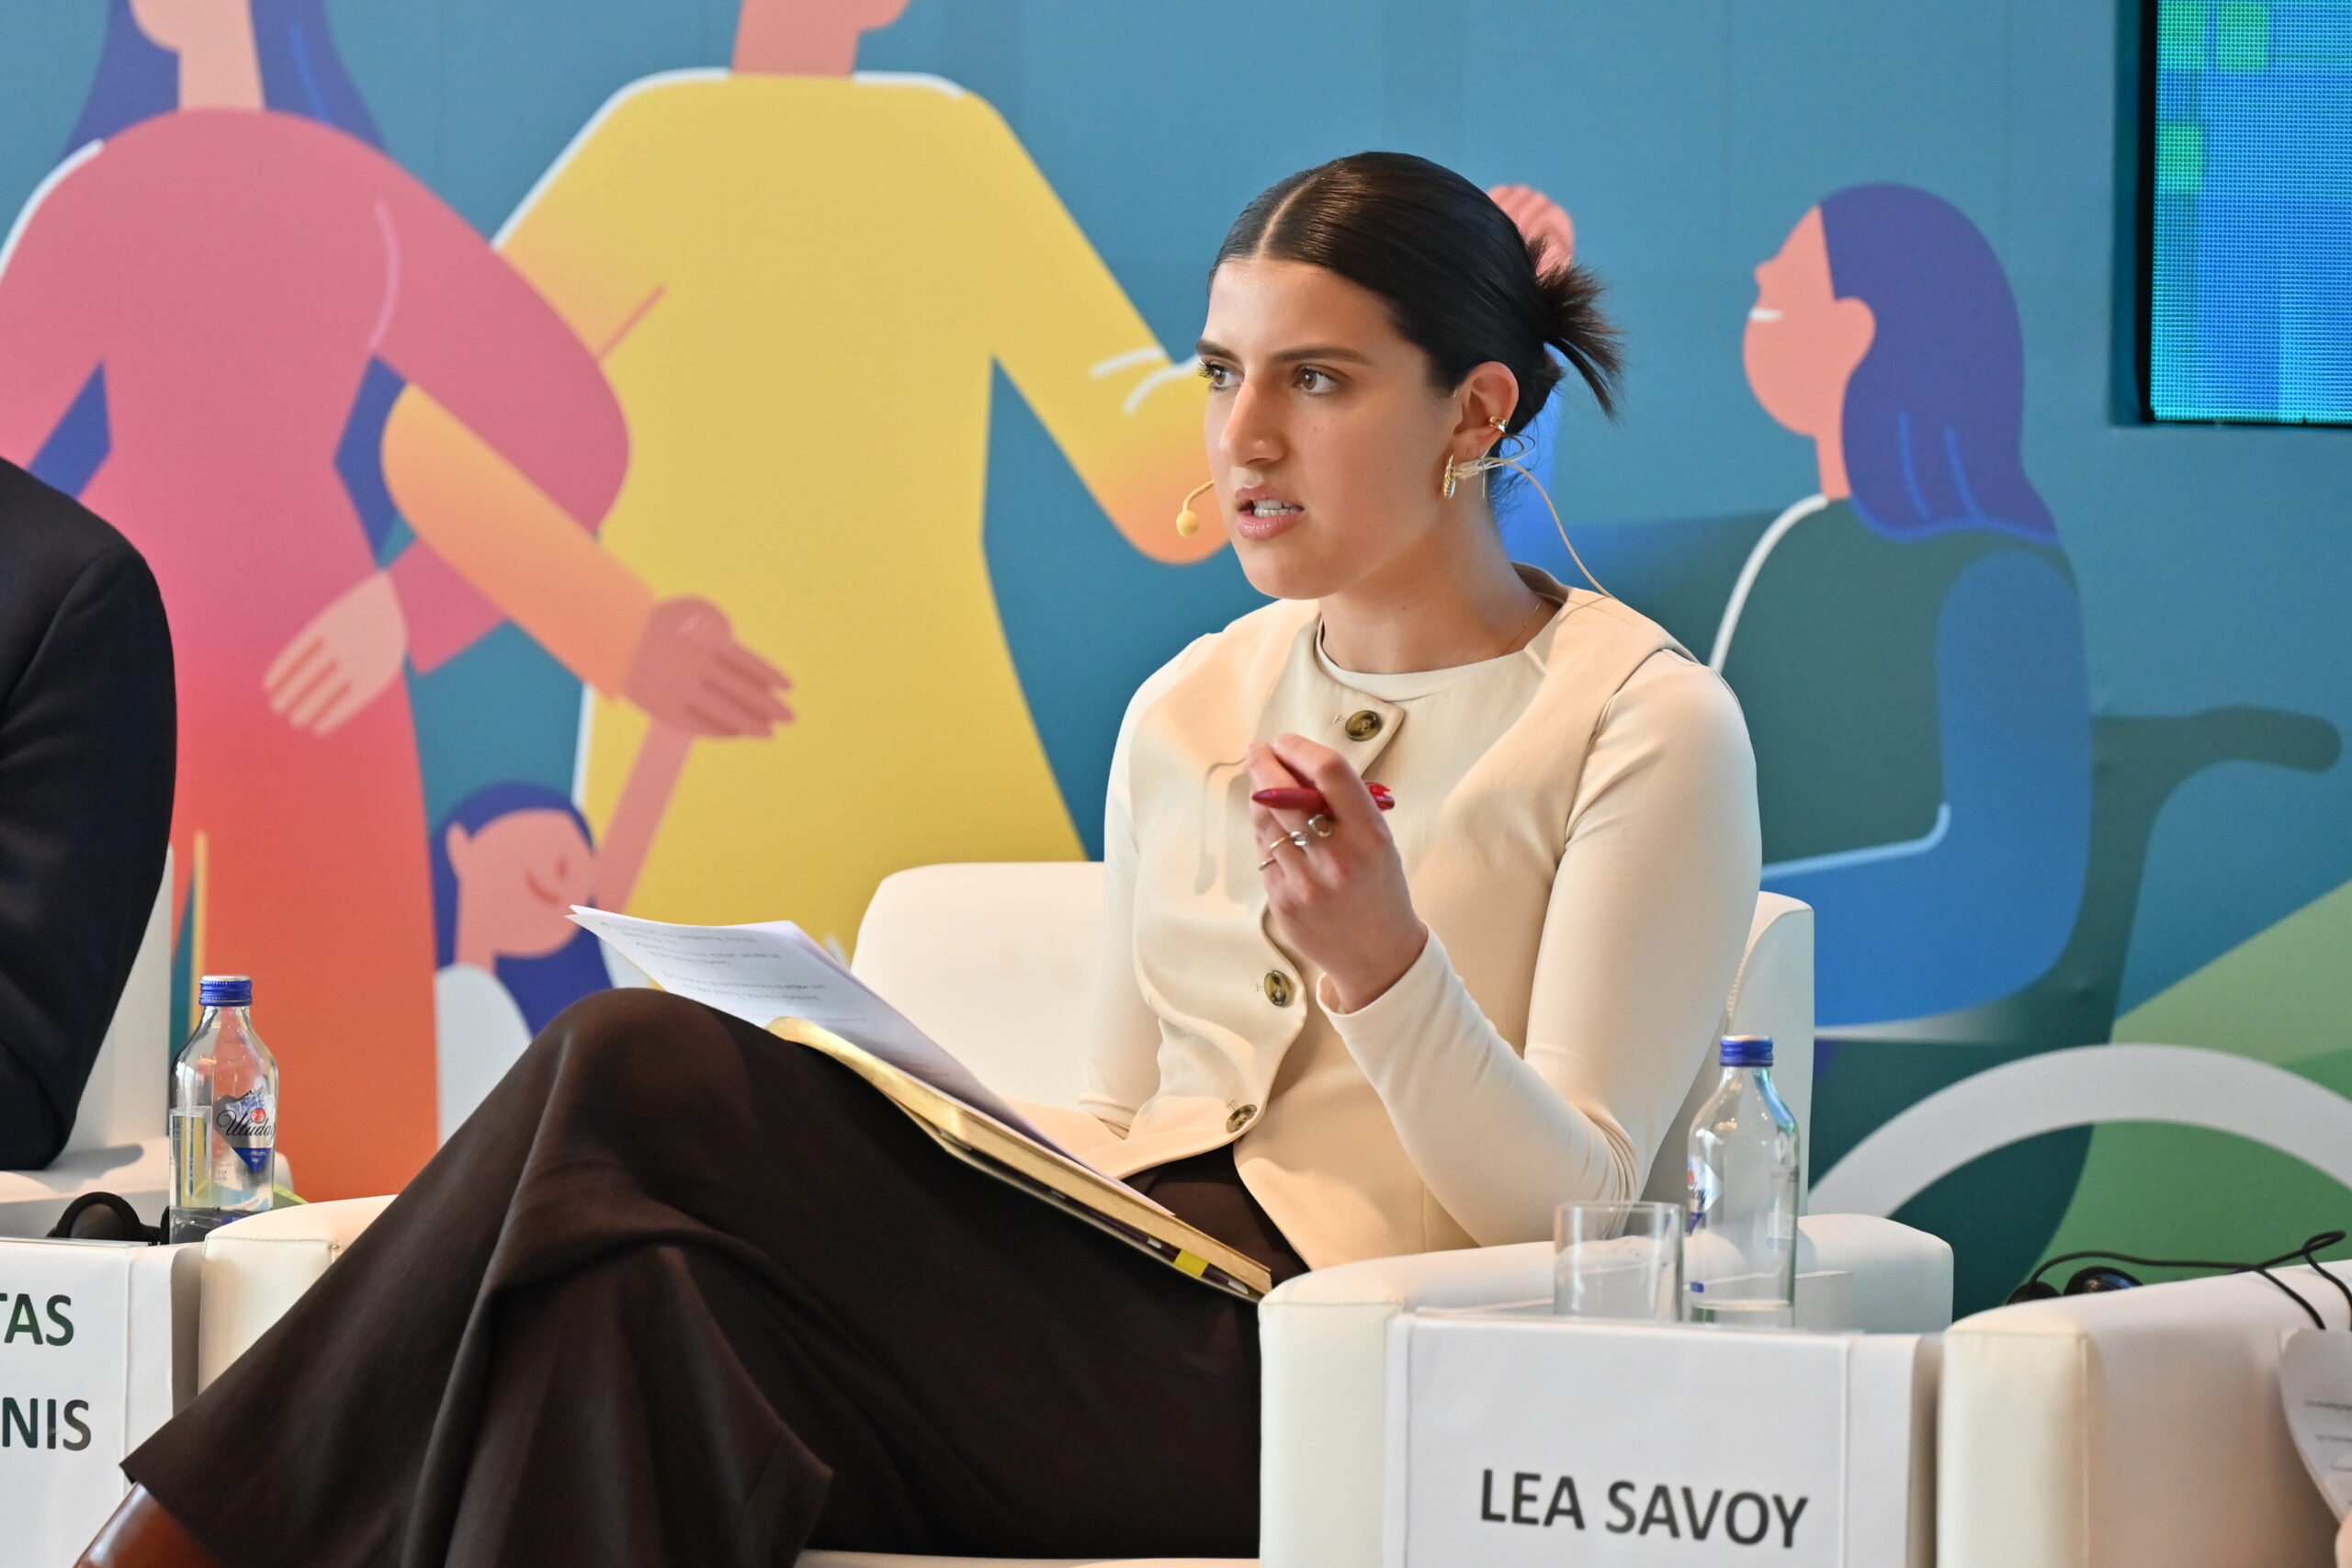
Emmanuel Letouzé speaks in one of the plenary sessions
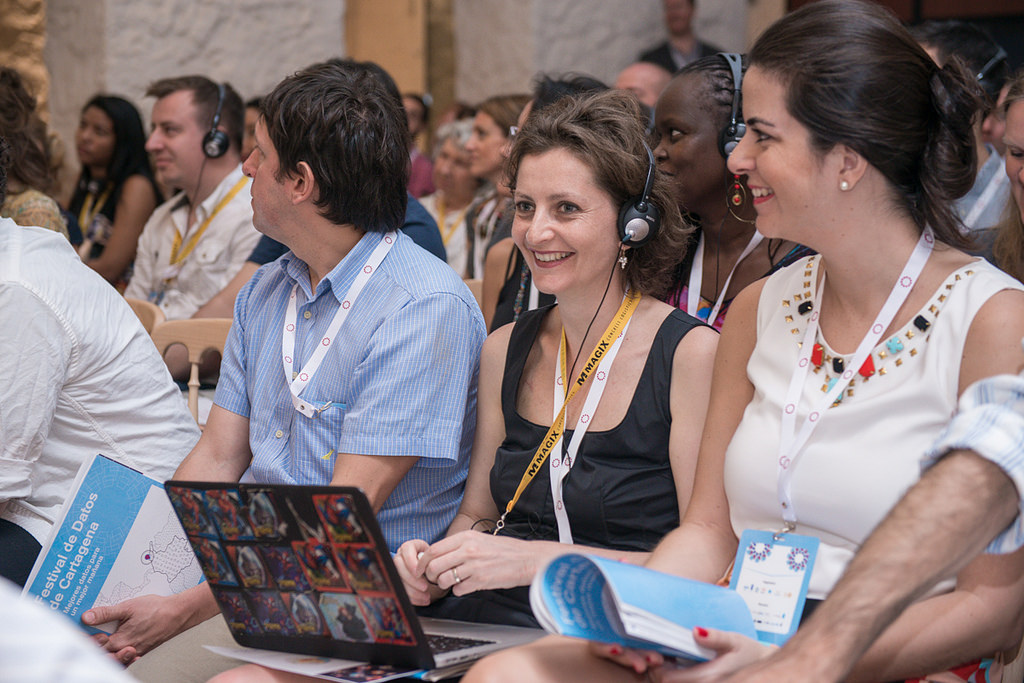
Full house at #BigData track in Cartagena #data2015 pic.twitter.com/Jww6V18DGv
— Data-Pop Alliance (@datapopalliance) April 20, 2015
Here are some resources to catch up on what took place:
- Recordings of Plenary Sessions
- Video interviews with participants
- Jorge Martin's incredible graphic scribing done in real time at the event.

- Photographs from the conference on Flickr
- The ScribbleLive stream
- A rolling list of resources associated with the festival
- Development Progress' blog series on the data revolution
- "Traditional vs. citizen-generated data: Is it a case of either-or?" by Kelli Rogers, devex.com, April 23, 2015.
- "'Intermediaries' to play key role in future of data for development" by Kelli Rogers, devex.com, May 19, 2015.
- "Life After the Cartagena Data Festival – We’ll Never Be the Same" by Kristen Stelljes, Program Officer, Hewlett Foundation, May 6, 2015.
- Interviews by Devex, including with Data-Pop's Director, Emmanuel Letouzé
The Human Development Report Office organized a Data Visualization Competition especially for the event, which received 80 submissions from 29 countries.
The winning visualization is The Human Development Tree by Jurjen Verhagen, an engineer and interactive visualization specialist from the Netherlands. Verhagen and the other two finalist entries, Close the Gap by Ri Liu and Visualizing the 2013 Human Development Index by InKyung Choi and her team, were invited to the festival to receive their awards from the Mayor of Cartagena and the Deputy Director of HDRO, in front of hundreds of data artists and scientists from around the world.
Congratulations to the winners of the Cartoon Movement competition!
We are pleased to announce the 4 winning cartoons, selected by voters at the Cartagena Data Festival and on the Cartoon Movement website. Thank you to all who participated and voted! Please click on these winning cartoons to Tweet about them:
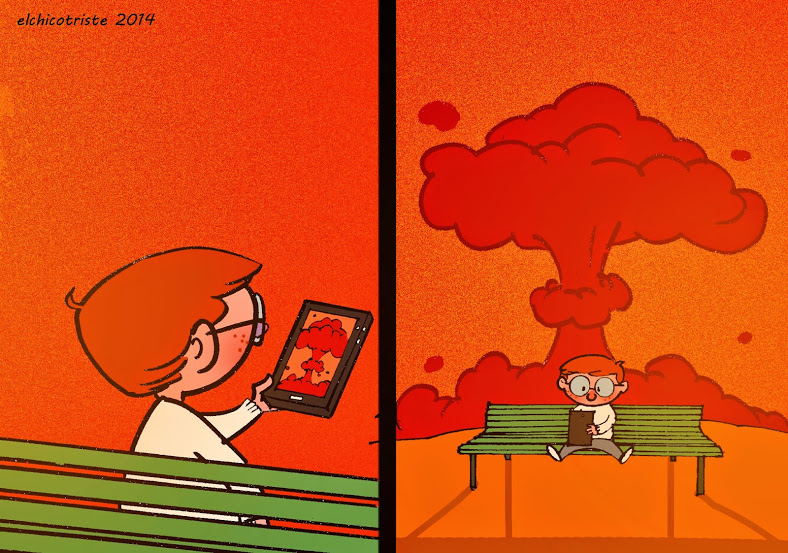
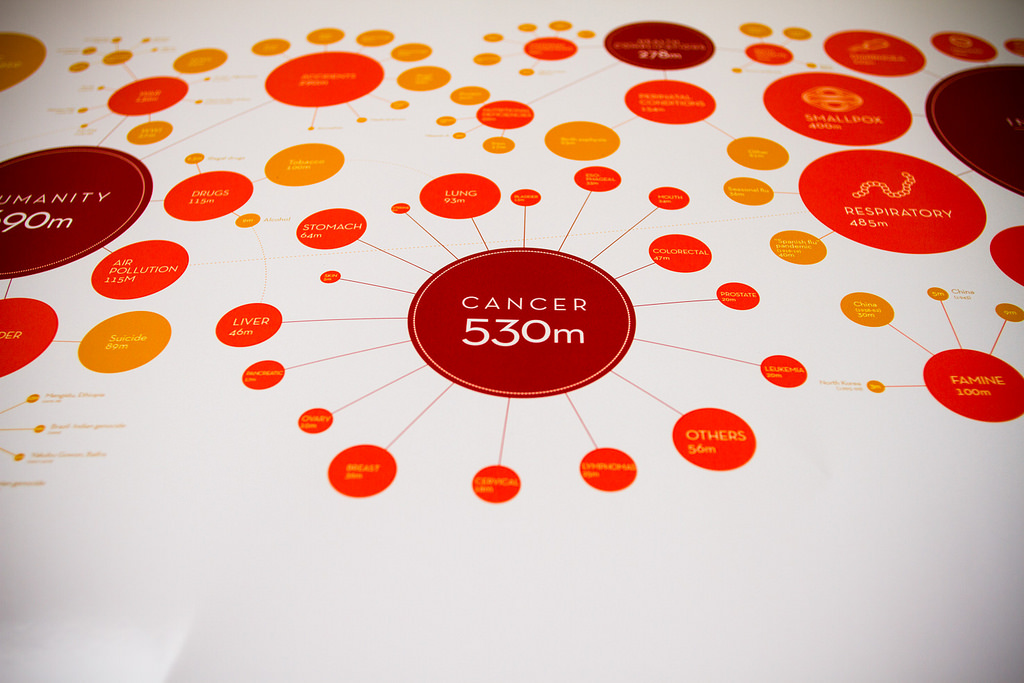
#DataCartoon15: Reality through the iPod screen We are more and more used to ignoring empirical reality to enclose ourselves in the digital version. |

#DataCartoon19: Twitter Tweets... freedom of expression |
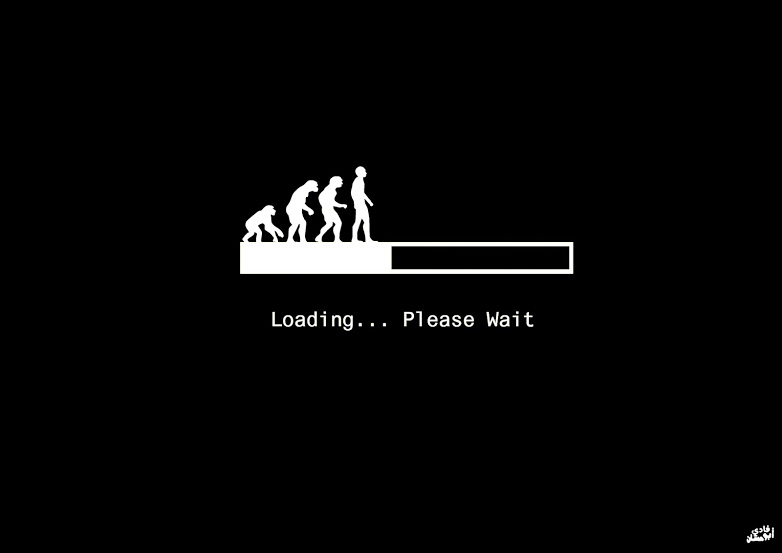
#DataCartoon17: The Evolution Data and Development |
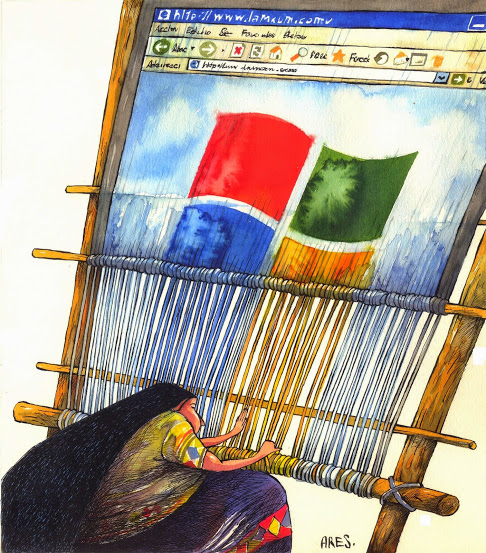
#DataCartoon3: Data and local cultures A cartoon about the local cultures, the poverty and new technologies |
Photo credits: © Oficina de Prensa Departamento Estadístico Nacional de Estadística (DANE)


![M002 - Feature Blog Post [WEB]](https://datapopalliance.org/wp-content/uploads/2025/10/M002-Feature-Blog-Post-WEB.png)

